Configure Logging and view your logs
1. Select the region under the project name. This is the location of the data center for deploying log storage.
Note: Logging may be unavailable in some regions. In this case, choose the region that is geographically closest to your equipment.
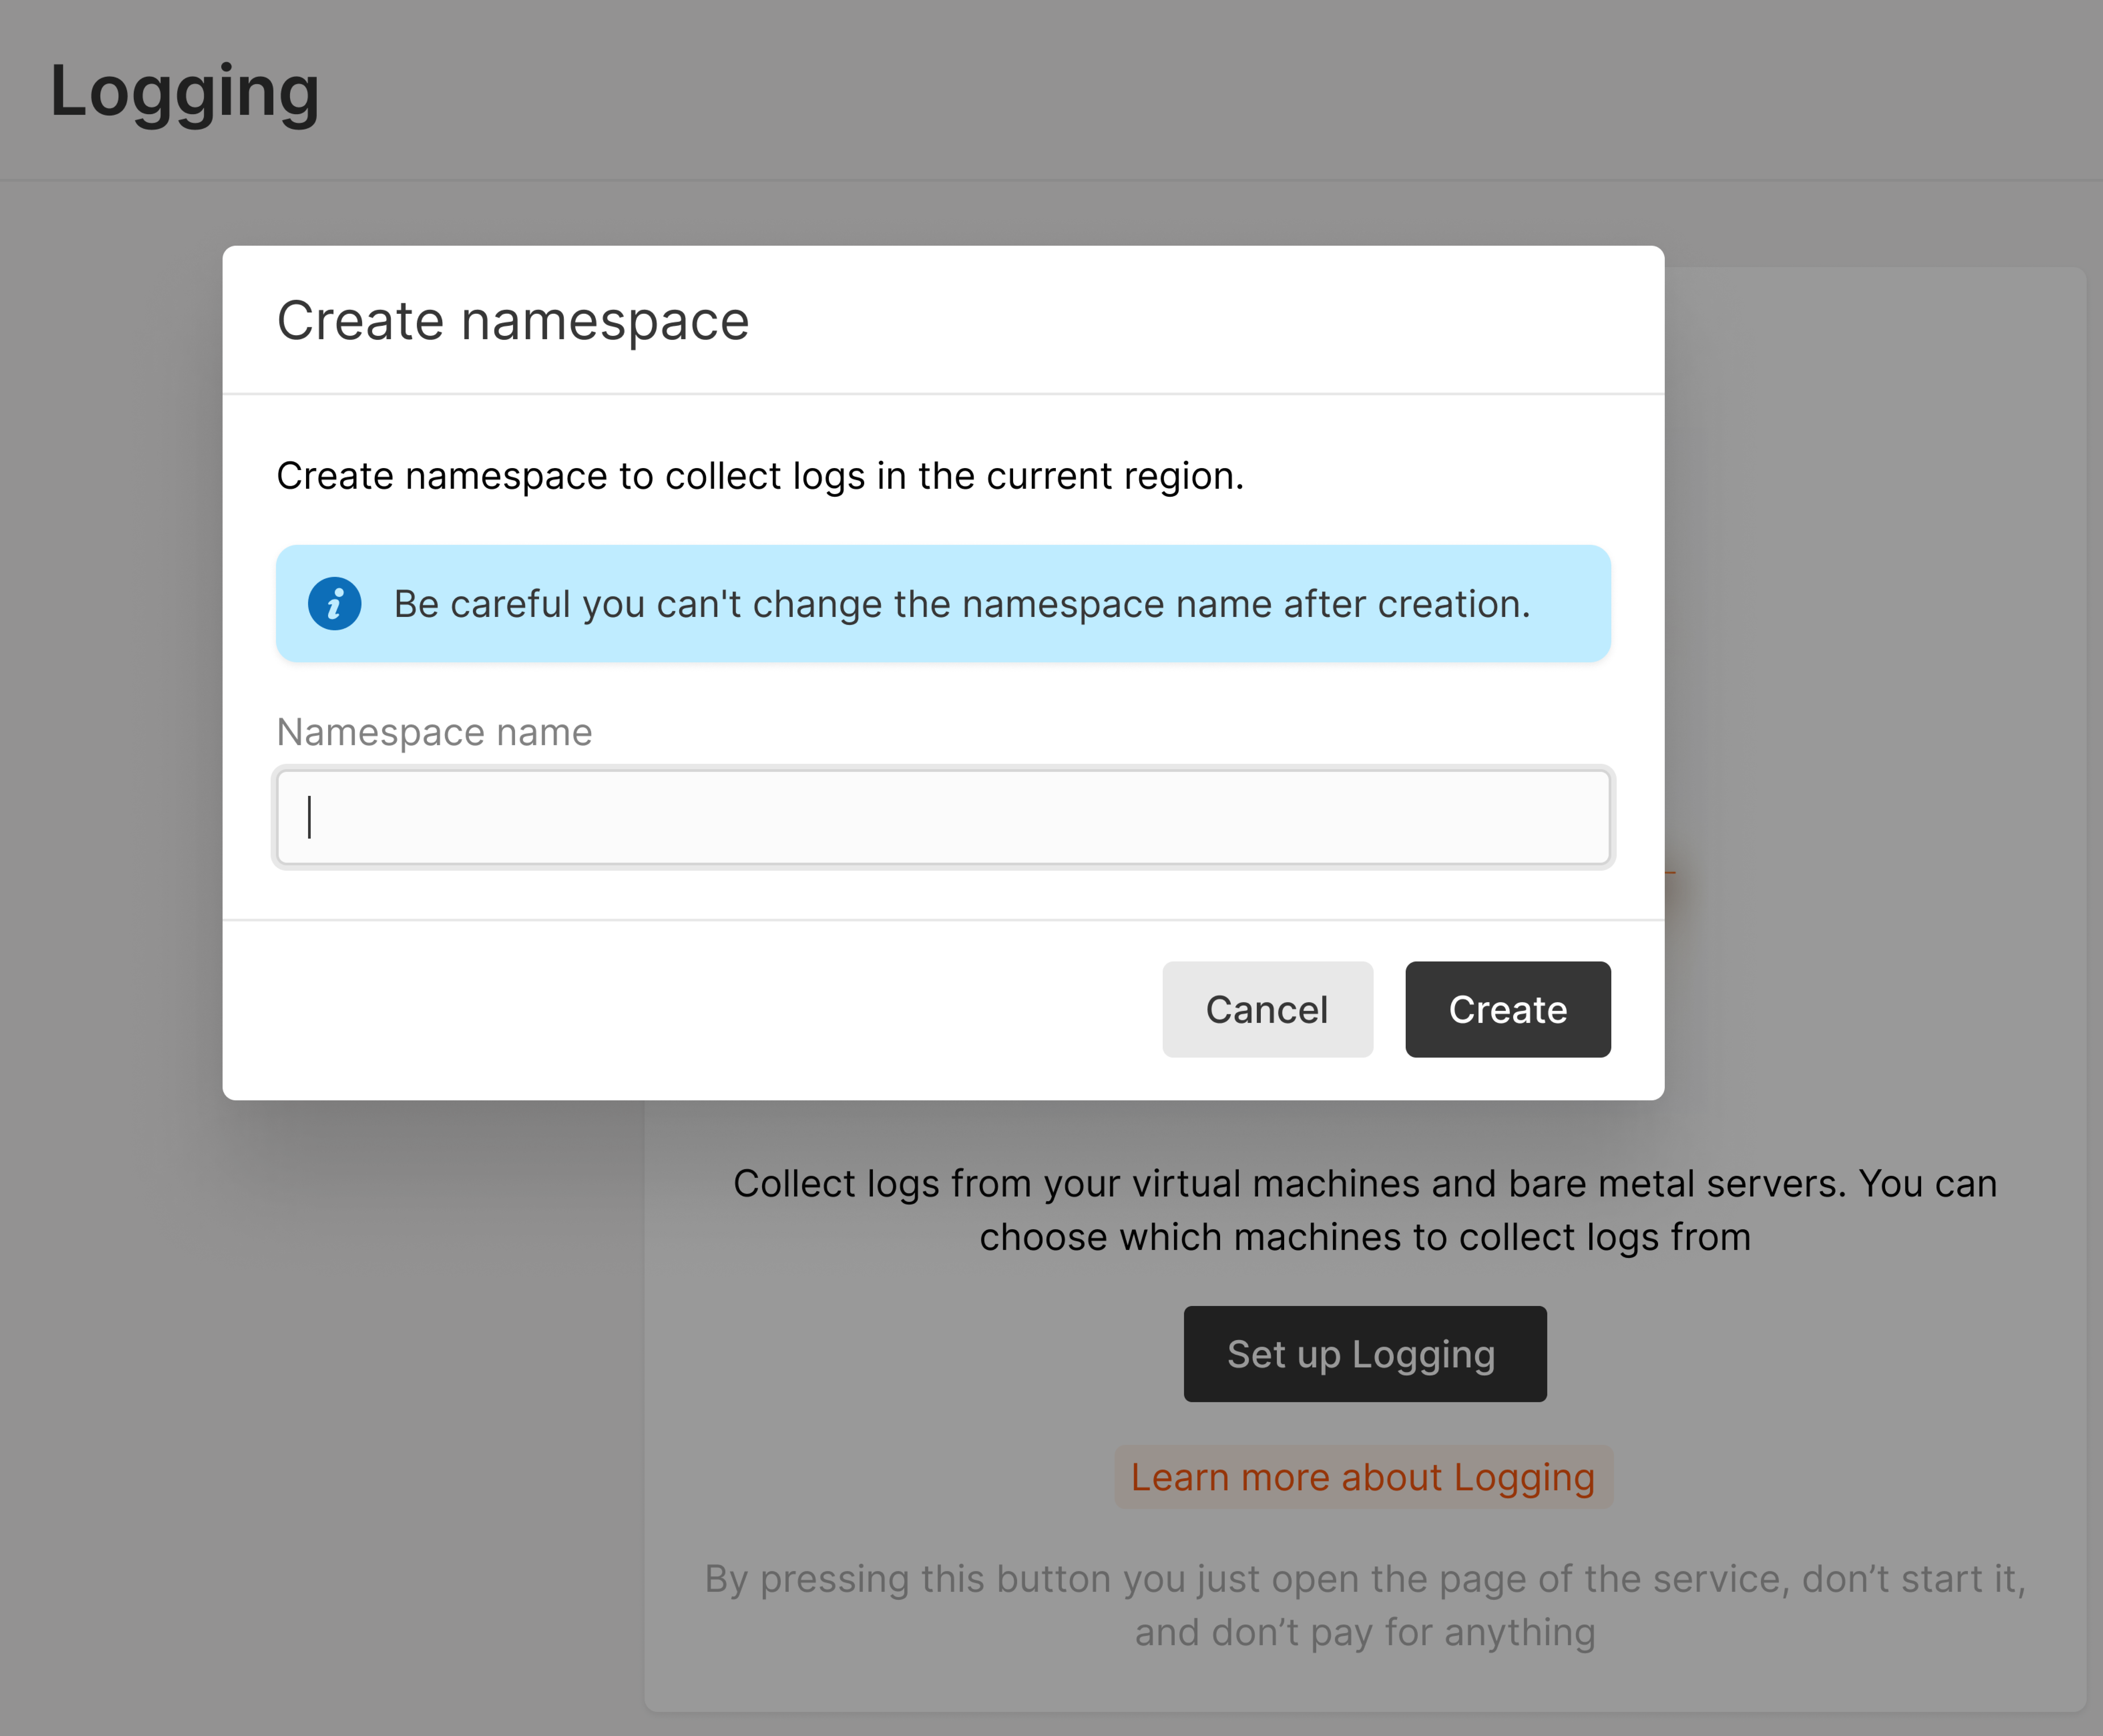
2. In the Cloud menu, go to the Logging tab, click Set up Logging. The pop up will appear.
Previously, when activating Logging, you could see a non-human-readable string, e.g., cbc25c71af8d4f7ca6cbbcdc5a4d68fe.your-topic as a namespace that is used as prefixed for topics. To make this process more user-friendly, we created the possibility of making human-readable namespaces, e.g., namespace123.your-topic.
Note: You can only create a namespace for a new project where the default value is not set up.
To create a namespace, input the namespace name according to the following restrictions:
- Lowercase Latin letters and digits can be used
- Underscore and spaces are prohibited
- Length is between 2–32
- The name should be unique for the destination region. If it’s already used, the system will suggest inputting another name.
Click Create.
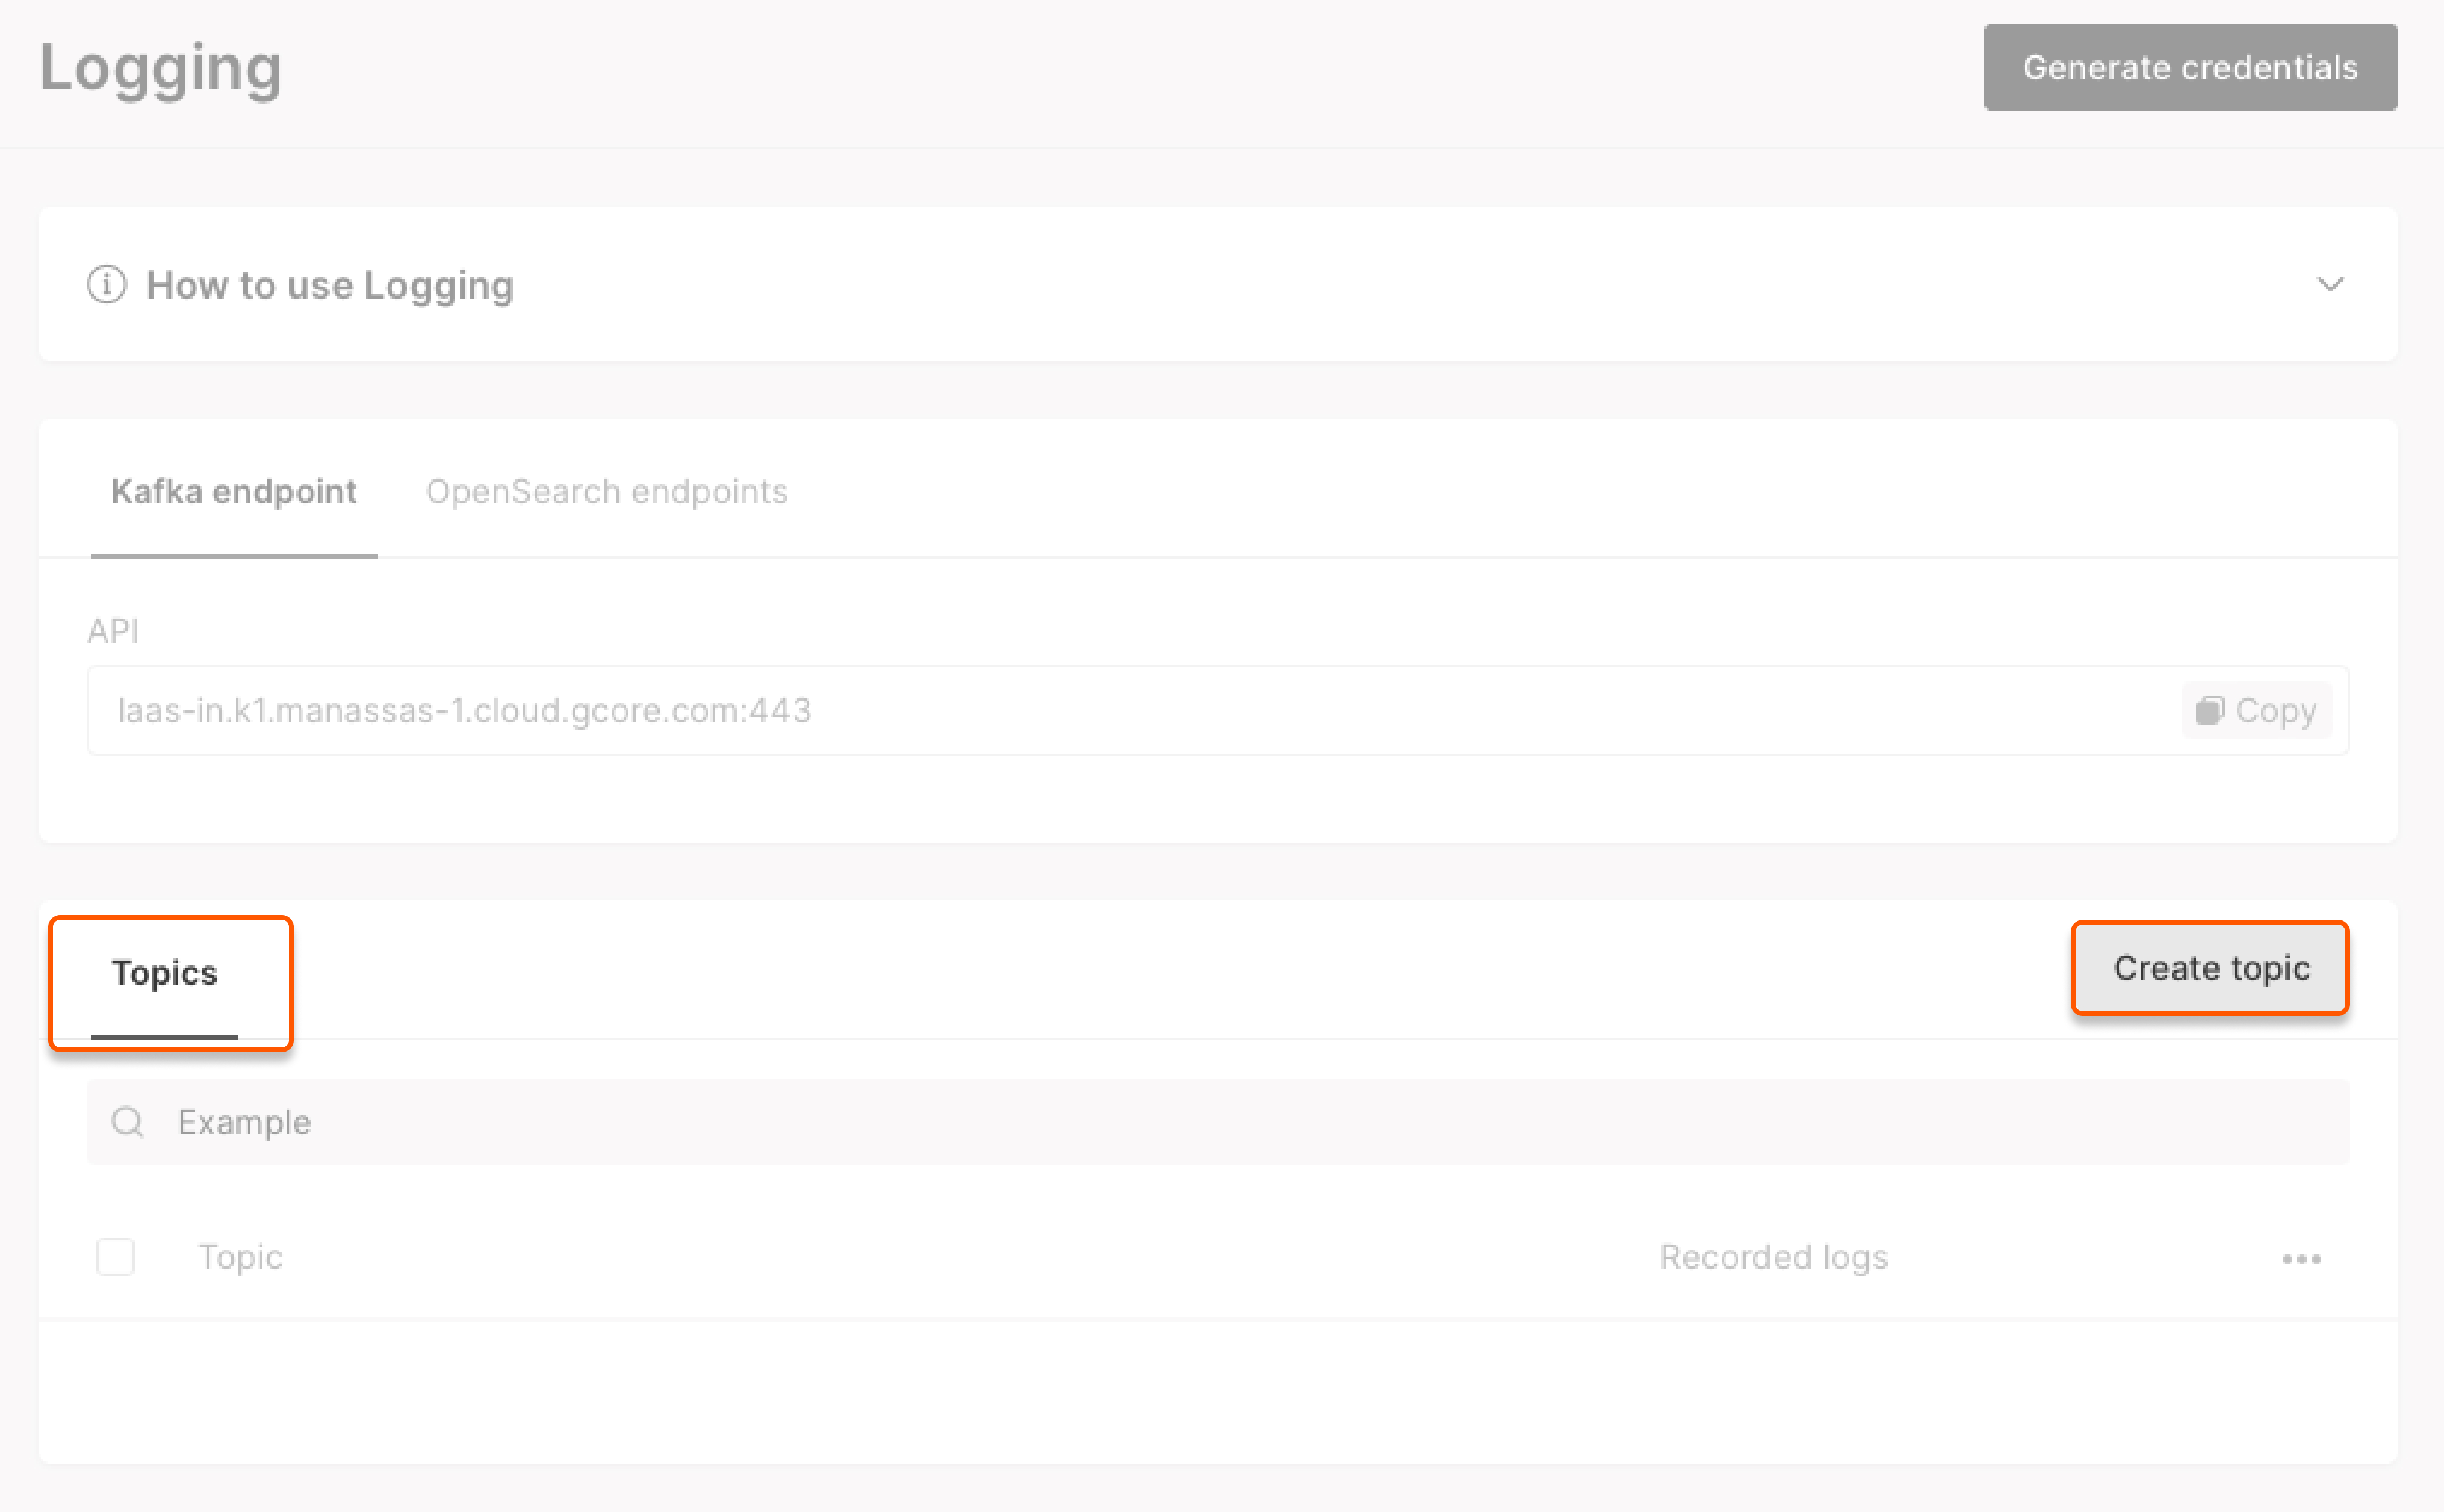
3. In the Topics section, click Create topic, name it, and click Save. We will create an index pattern for your topic in OpenSearch Dashboards with “@timestamp” as the default time field.
4. Click Generate credentials in the upper-right corner to get a login and a password for the storage. Save them immediately because you won’t be able to see them again after closing the window.
These credentials are used to connect your log delivery systems to the topic for log export.
If you forget your credentials, click Generate credentials again for a new pair. Don’t forget to update your credentials in the settings of the installed log shippers.
If you use Logging in multiple regions (Step 2), a new storage will be created in each region, and you will need to generate unique credentials for each one.
5. Select a log shipper (e.g. Fluent Bit, Filebeat, or Logstash) that supports Kafka output.
Configure the log shipper with our Kafka endpoints, credentials generated at Step 4, and target topic name “yourusername.topicname”. We recommend using “@timestamp” as the default time field in your log shipper. If you prefer to use another time field, you should delete the pre-created index pattern and create a new one with a desired time field.
Note: Log message size is max 1 MB in text/JSON format, limited to 225 fields. Once the log shipper is set up, your device logs are sent to your Kafka topic. From there, the Kafka servers will automatically transfer them to our OpenSearch servers.
6. Go to the OpenSearch Dashboards by using the URL specified on the Logging page.
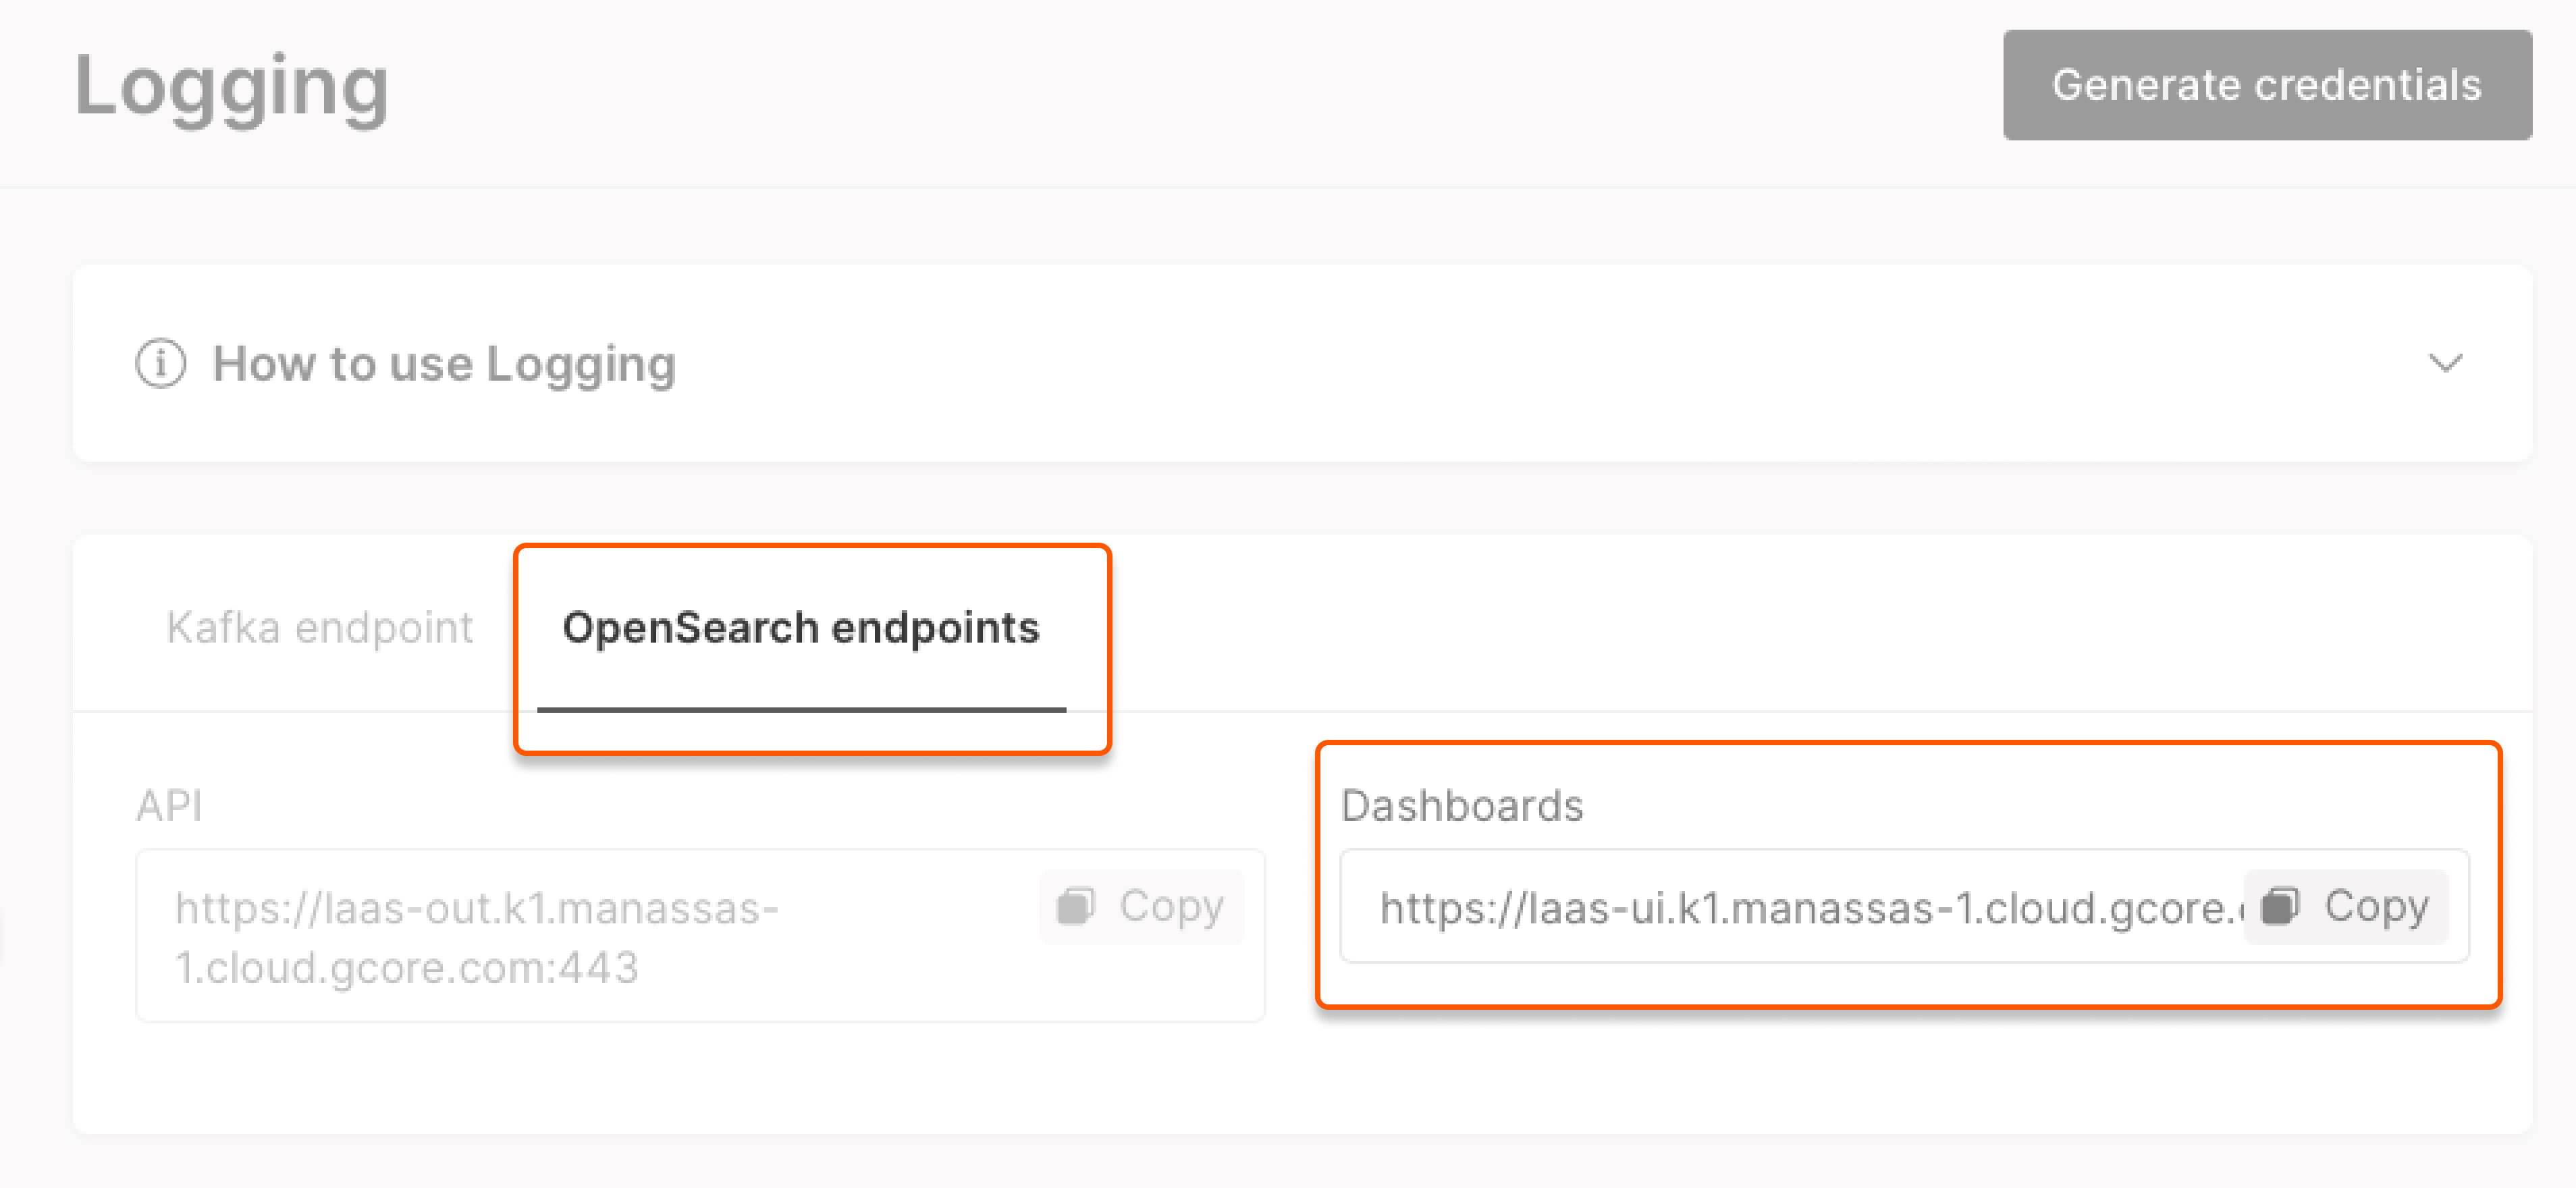
For log in, use the credentials generated at Step 4.
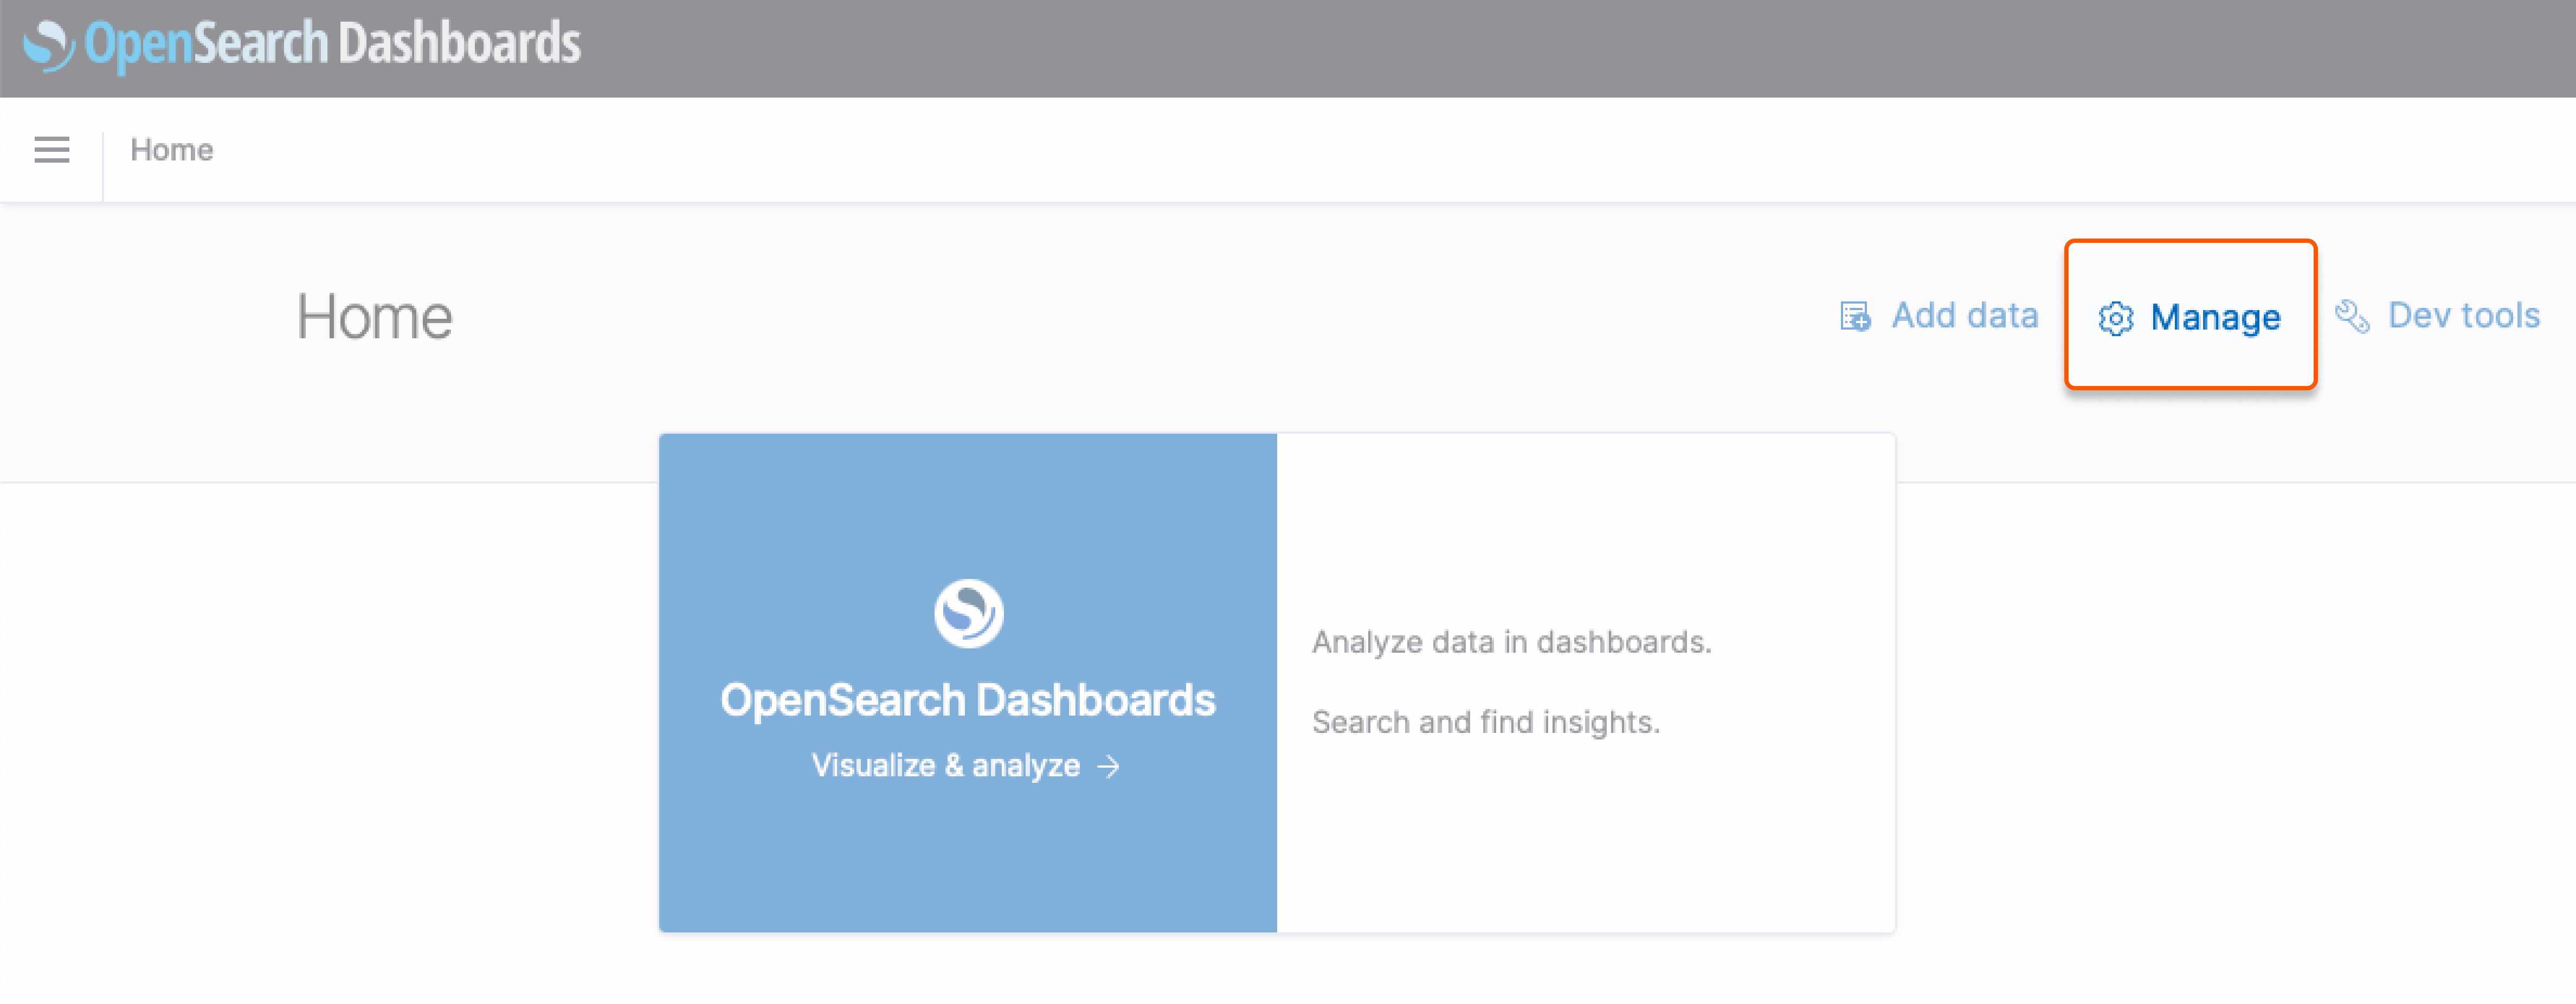
7. If you have set the time field to “@timestamp” at Step 5, you would see the pre-created pattern on the dashboard. The setup is complete for you and can go to Step 11.
If you have selected another time field, delete the pre-created index pattern first and then create a new one. To do it, click Manage on the home page → Index Patterns.
8. Click Create an index pattern at the bottom of the screen.
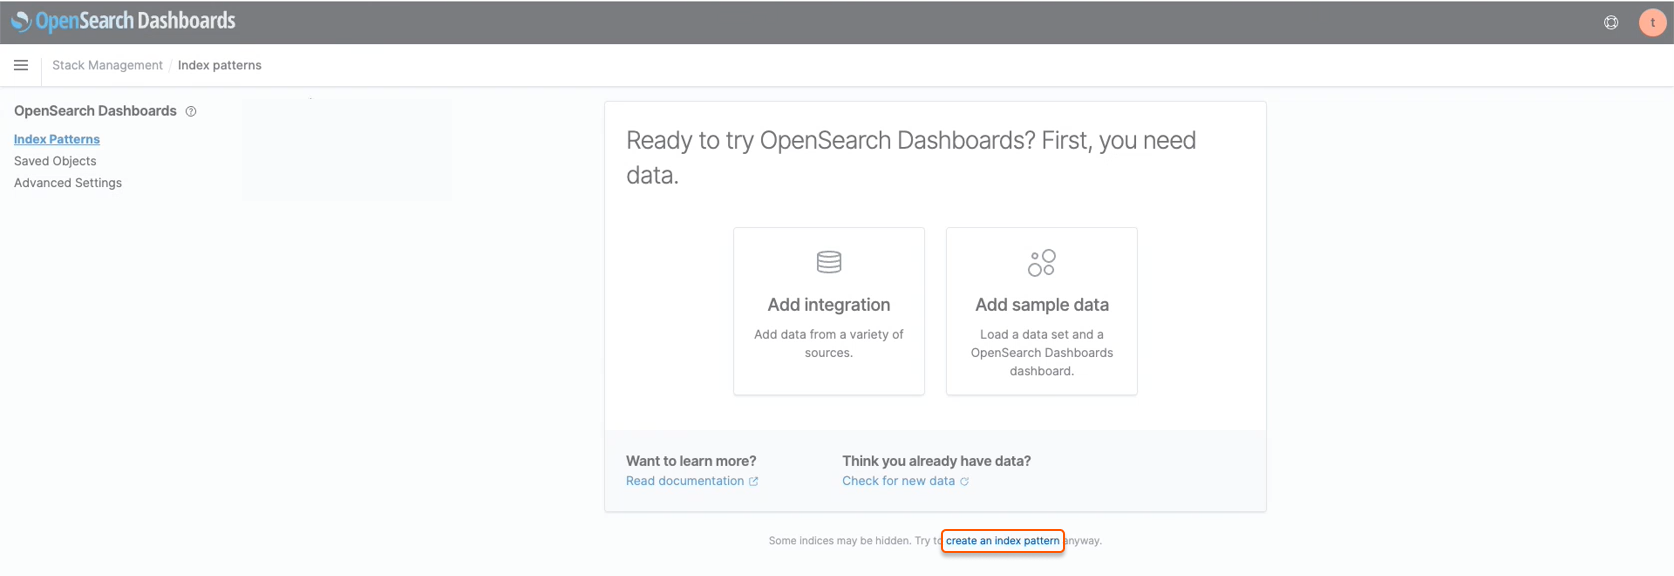
On the OpenSearch server, your logs are linked to your personal index, which has the same name as your topic. By creating an index pattern, you set up a filter that helps OpenSearch Dashboards display the logs with the required index.
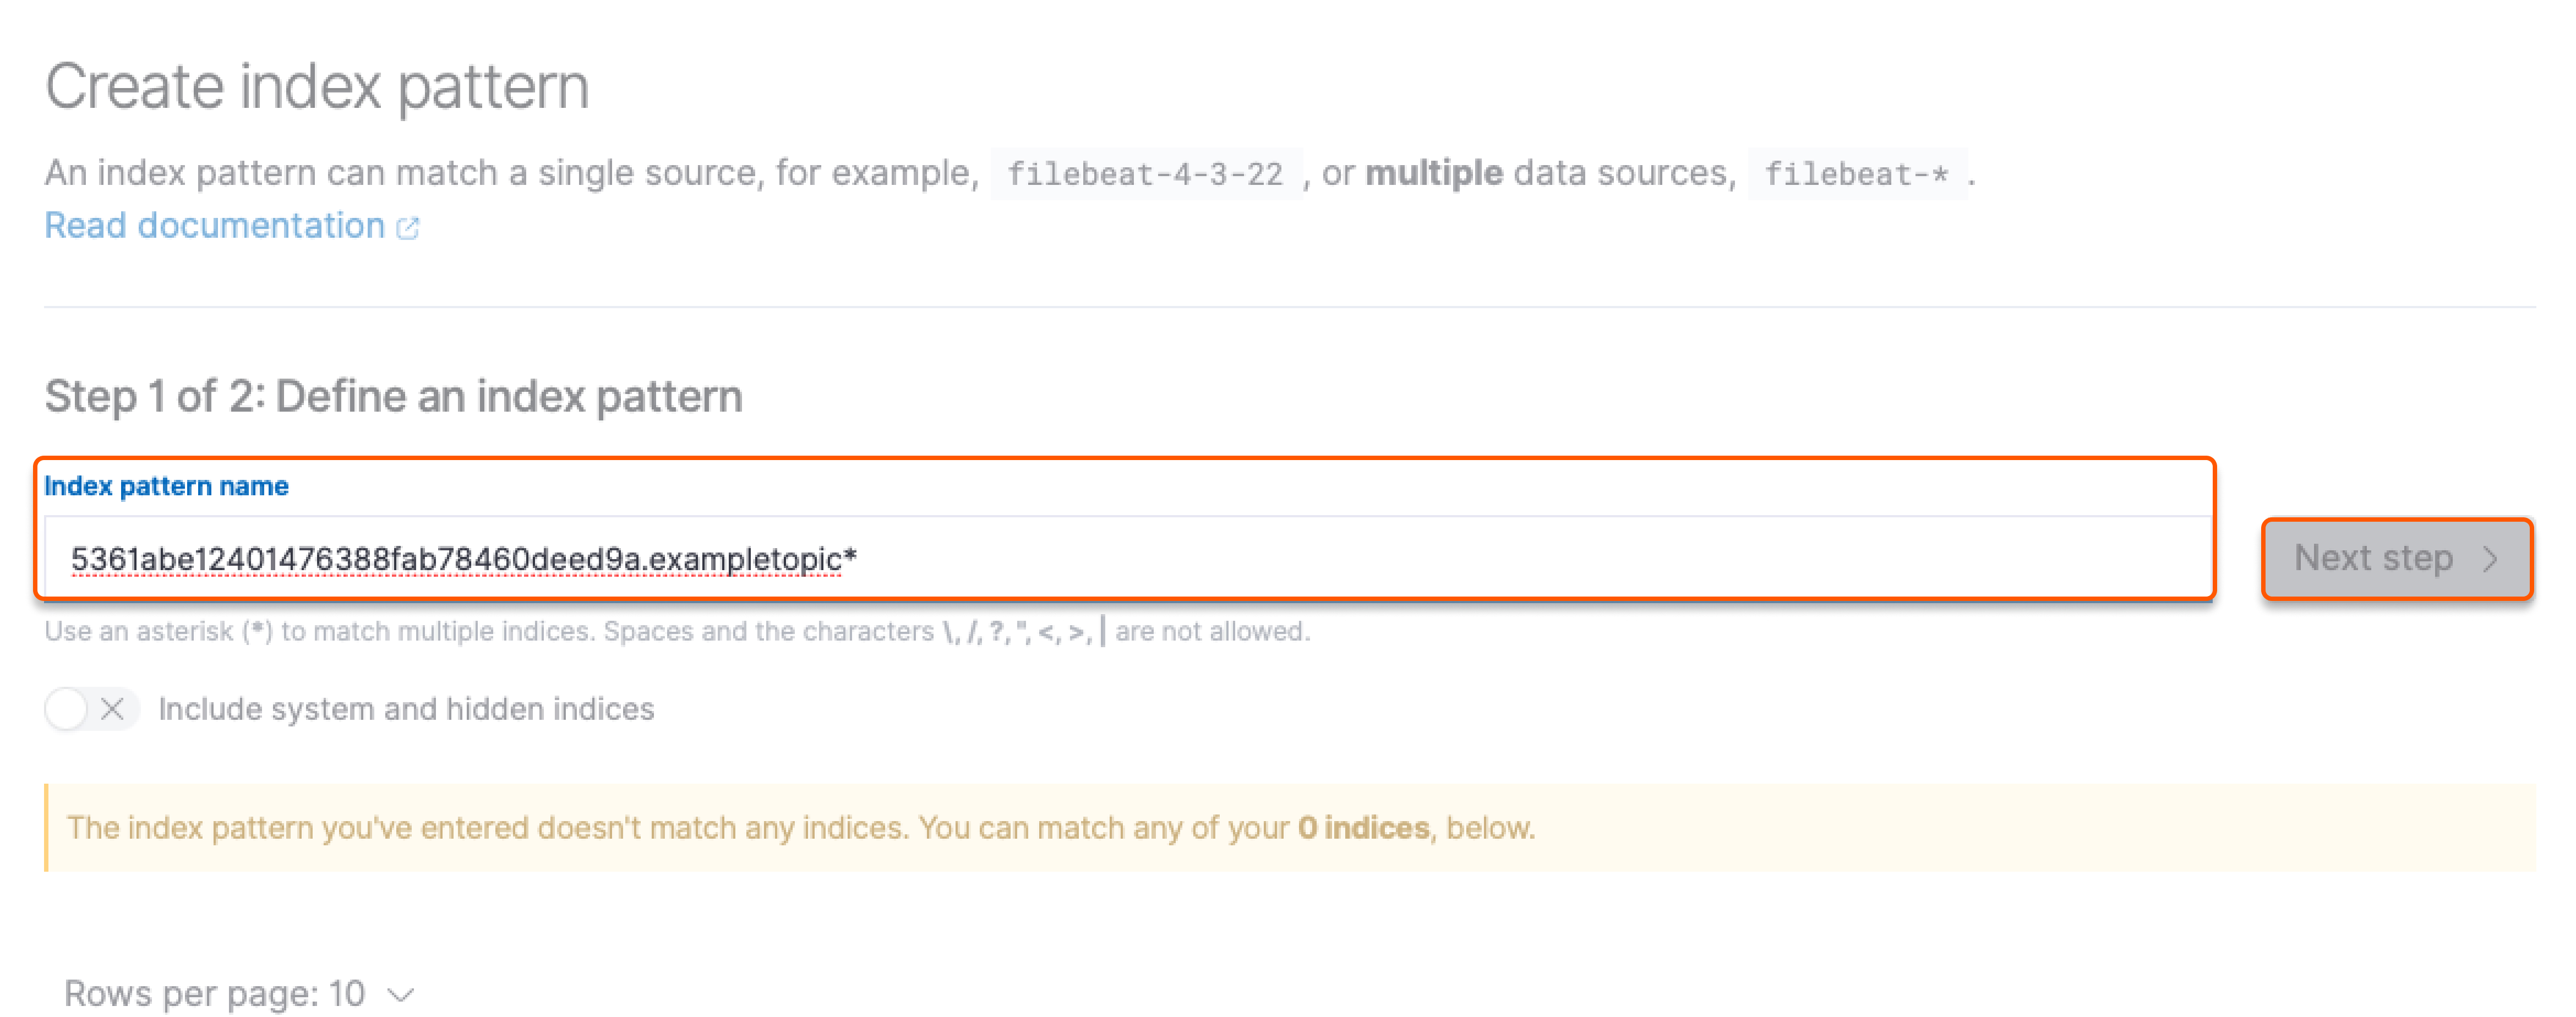
9. In the index-pattern field, enter your username, which can be found in the credentials that were generated at Step 4. Then, add a dot (.) and the name of the topic you created at Step 3, followed by an asterisk (*).
For example, if your namespace is “5361abe12401476388fab78460deed9a” and you have created a topic named “exampletopic”, enter “5361abe12401476388fab78460deed9a.exampletopic*'” in the field. Finally, click Next step to proceed.
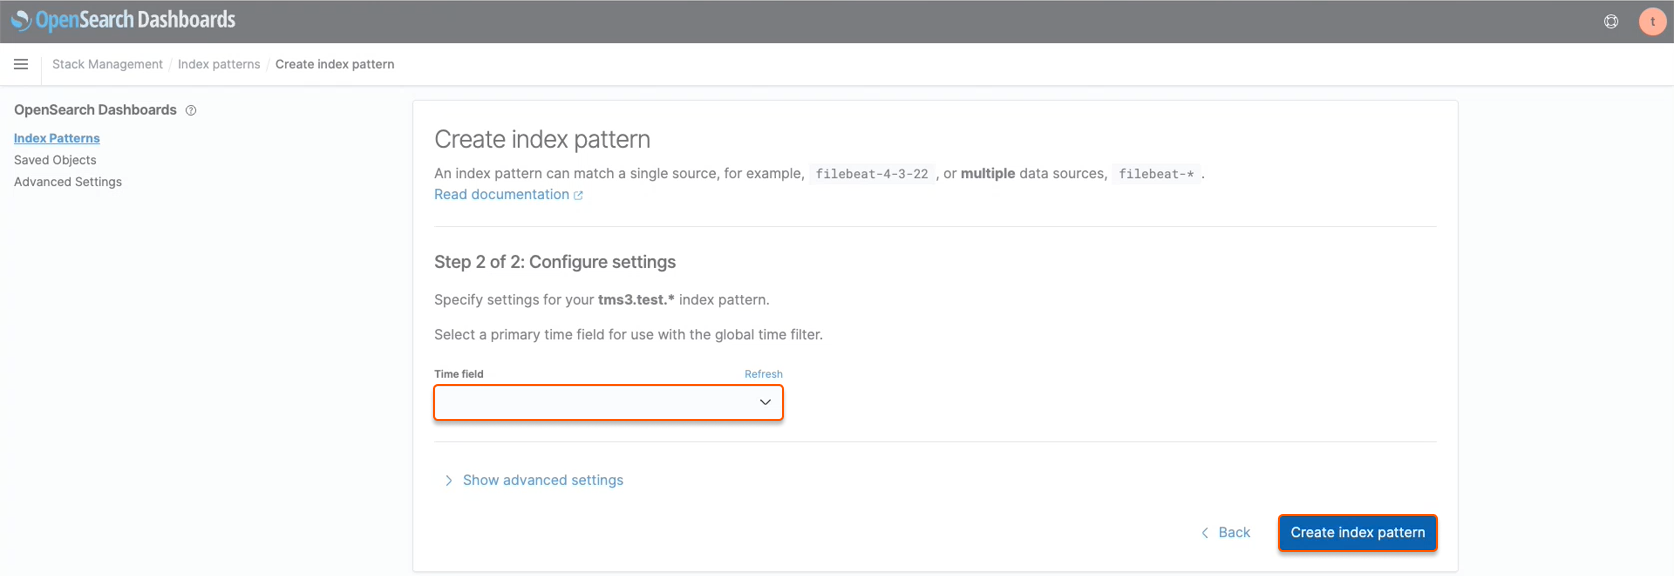
10. Select the date and time format from the dropdown list, and click Create index pattern to make your logs accessible in OpenSearch Dashboards. The pattern is saved, so you don't have to set it up again next time you log in.
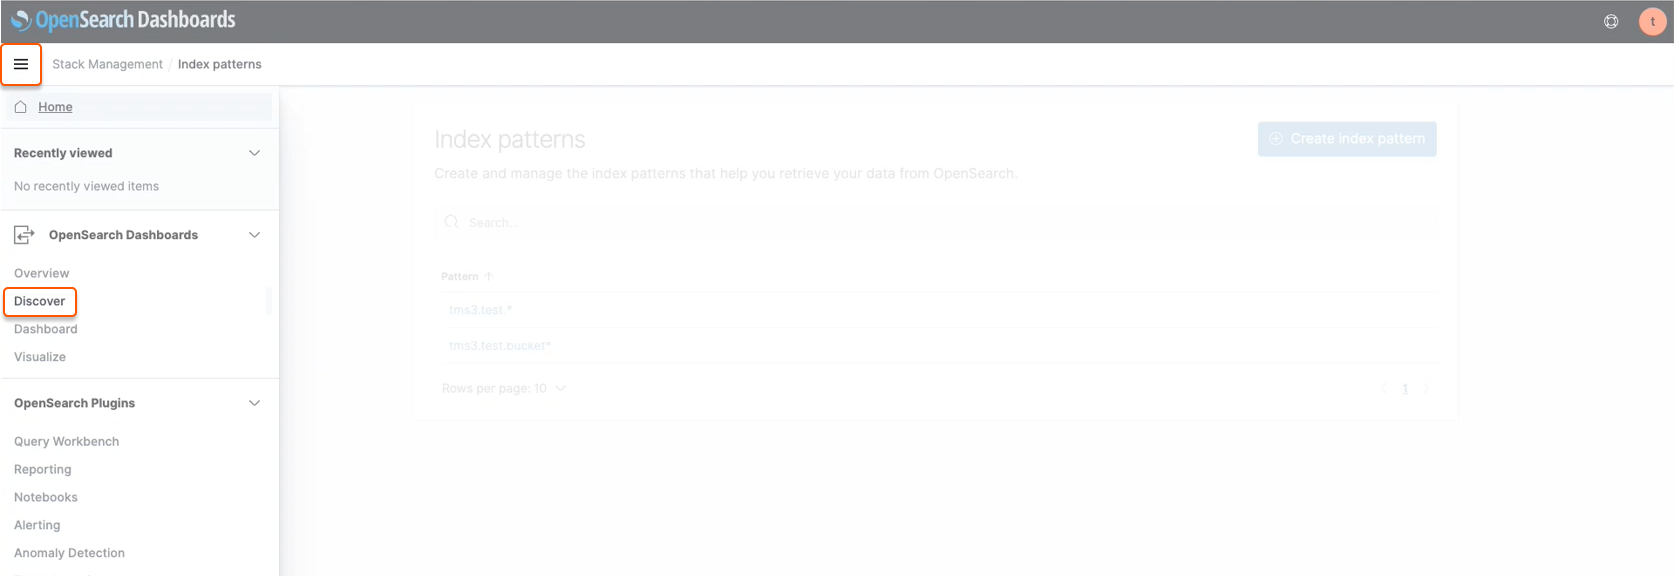
11. Setup is complete. To view your logs, go to the main menu and select Discover.
Was this article helpful?
Not a Gcore user yet?
Discover our offerings, including virtual instances starting from 3.7 euro/mo, bare metal servers, AI Infrastructure, load balancers, Managed Kubernetes, Function as a Service, and Centralized Logging solutions.